Publications
LCA produces tailored briefings and high quality visuals and infographics that provide valuable insight and commentary ensuring that our clients are fully aware of decisions and announcements that may impact on their strategies and objectives.

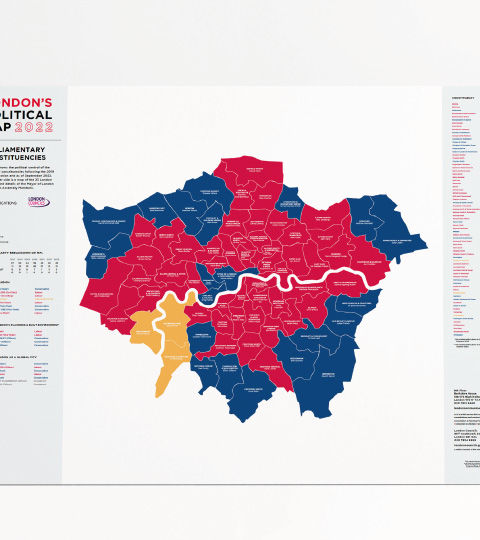
Political Map of London – 2022
A political atlas produced annually by LCA in partnership with London Councils. It shows political control of London’s 73 constituencies following the 2019 General Election, as well as of the capital’s 33 boroughs following the 2022 Local Elections. This latest edition also includes maps of the London Assembly’s super-constituencies, of the city’s five sub-regional borough partnerships, as well as the Inner-Outer London boundary, along with a host of further information about the capital’s political landscape.
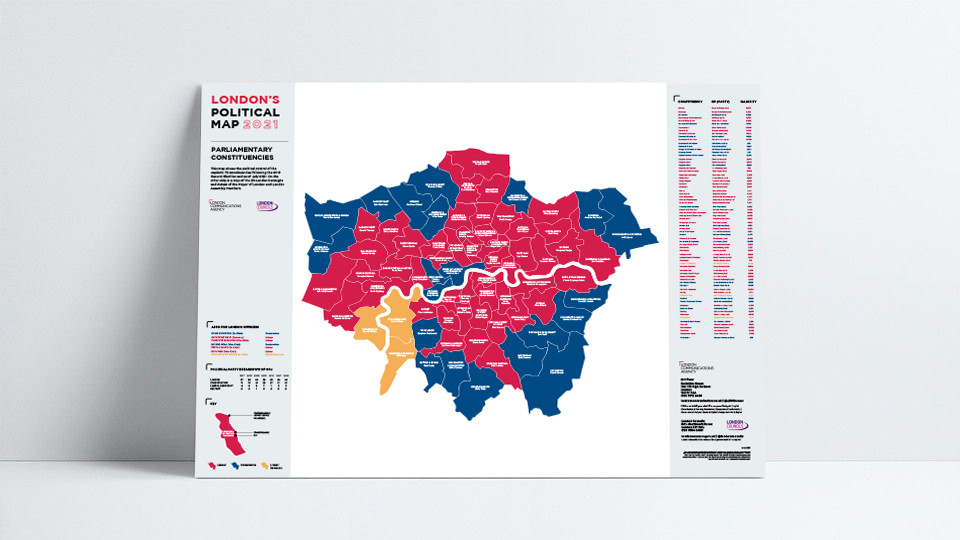
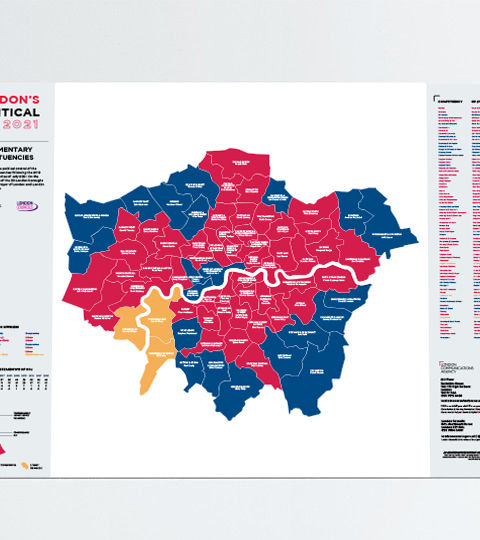
Political Map of London – 2021
This map shows the political control of the capital’s 73 parliamentary constituencies following the 2019 General Election and as of July 2021. On the other side is a map of the 33 London boroughs, plus details of the Mayor of London and London Assembly Members elected at the 2021 GLA Elections.

General Election Results Briefing – December 2019
With only four seats changing hands in London and the final tally of seats-per-party in the capital no different to 2017, one would be forgiven for thinking that nothing really changed. The LCA team has taken a closer look and found there’s more than meets the eye. We go through seven key points below and consider what this all means for the next (currently scheduled) vote in London – the Mayoral and London Assembly election on 7 May.

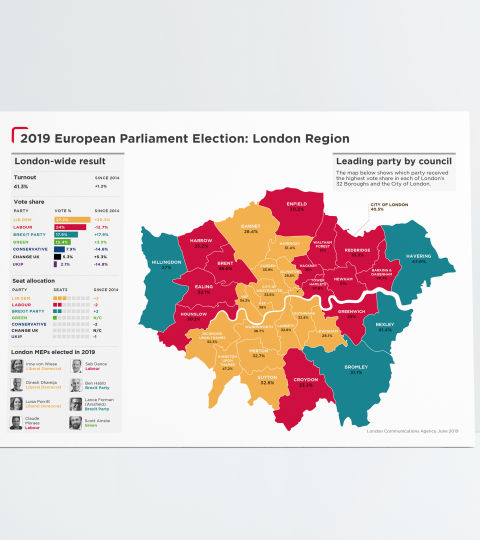
2019 European Parliament Election – London Region
This map shows the leading party’s vote share in each of London’s 32 Boroughs and the City of London at the last European Parliament elections. It also lists the election’s overall results for the London Region, in terms of vote share as well as seats won (and lost) by each party.

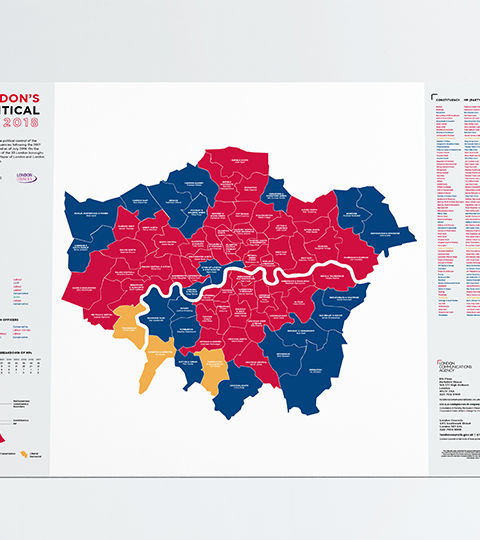
Political Map of London – 2018
This map shows the political control of the capital’s 73 parliamentary constituencies following the 2017 General Election and as of July 2018. On the other side is a map of the 33 London boroughs and details of the Mayor of London and London Assembly Members.
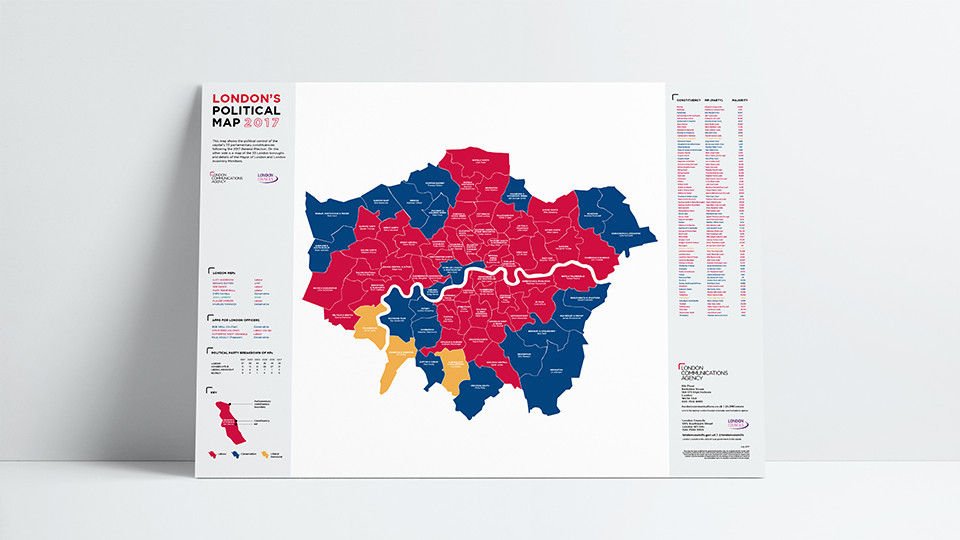
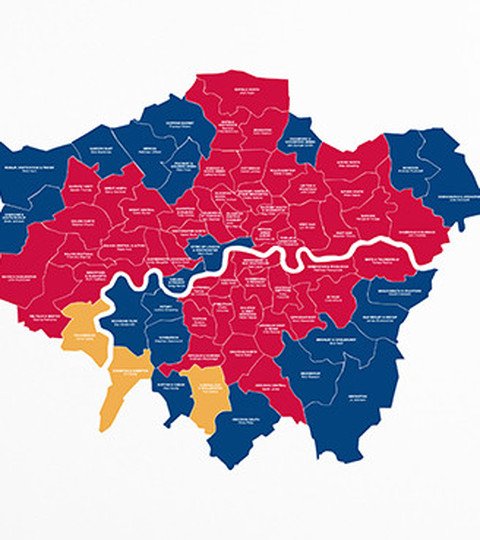
Political Map of London - 2017
This map shows the political control of the capital’s 73 parliamentary constituencies following the 2017 General Election. On the other side is a map of the 33 London boroughs and details of the Mayor of London and London Assembly Members.
General Election Results Briefing – June 2017
We were supposed to have a year off elections! But 8 June 2017 saw a snap General Election, called by the Conservatives. Read our special Results Briefing, focusing on the national headlines, the London story for the 3 main parties, and the most interesting results in the capital.

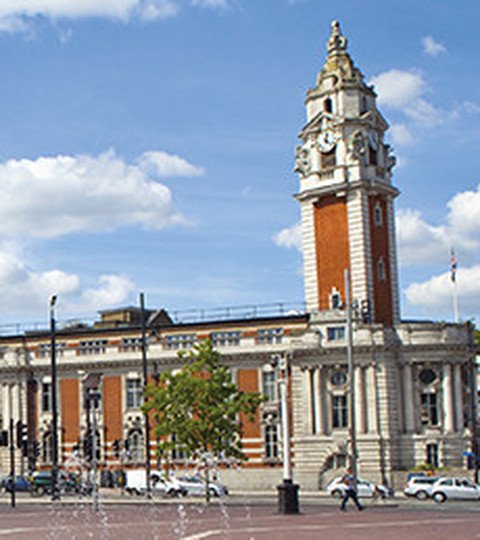
Looking towards May 2018
This special briefing will explore why the fifth London local elections could be the most politically disruptive we have faced, what it could mean for the boroughs and the impact on all of us who work in the capital, trying to get things done between now and then.

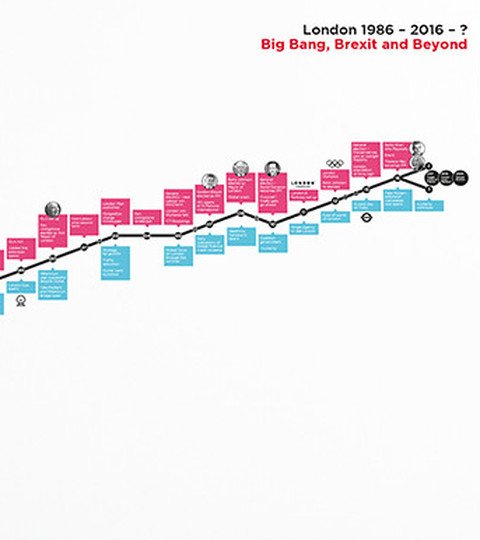
Big Bang, Brexit & Beyond
30 years ago the City of London was transformed with the abolition of the GLC. 30 years on, big questions hang over the City and London itself post Brexit. Our infographic shows the City’s history.

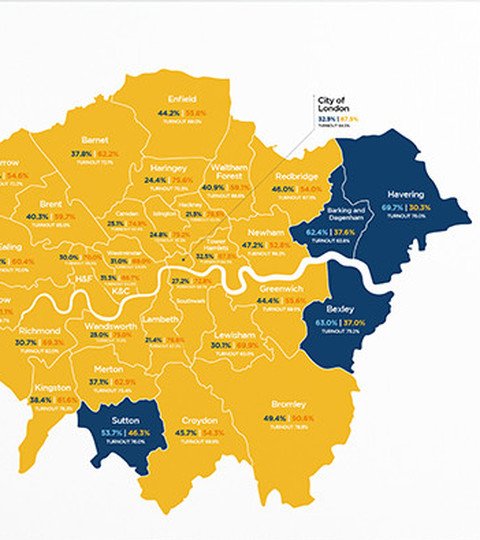
EU Referendum votes: Borough breakdown
See our borough-by-borough breakdown of how London voted in the EU Referendum on 23 June 2016.

